Trajectory Dashboard
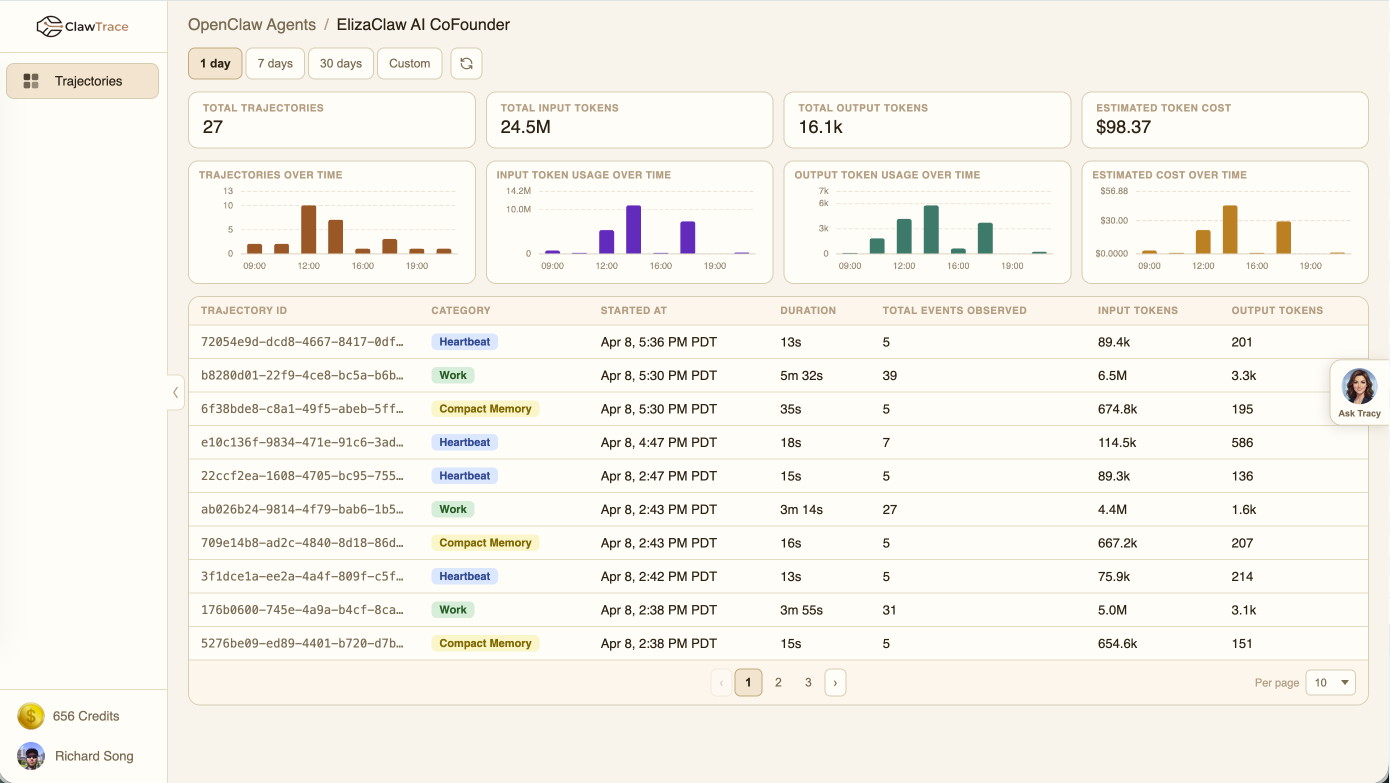
The trajectory dashboard gives you a complete view of all agent runs for a specific connection. It combines metrics, trends, and a detailed run table to help you understand agent behavior at a glance.
Metrics Overview
The top section shows four key metrics for the selected time range:
- Total Trajectories — Number of agent runs
- Total Input Tokens — Tokens sent to LLMs
- Total Output Tokens — Tokens received from LLMs
- Estimated Cost — Calculated from model-specific pricing
Trend Charts
Four bar charts show how metrics change over time:
- Trajectories per period — Run frequency over time
- Input tokens per period — LLM input volume
- Output tokens per period — LLM output volume
- Cost per period — Spend over time
The time bucketing adapts to your selected range: hourly for 1 day, daily for 7 days, weekly for 30+ days.
Time Range Selector
Choose from preset ranges (1 day, 7 days, 30 days) or set a custom date range. The dashboard refreshes automatically when you change the range.
Trajectory Table
The table below the charts lists individual agent runs with:
| Column | Description |
|---|---|
| Trajectory ID | Unique identifier (click to drill into detail) |
| Category | Auto-classified: Work, Heartbeat, or Compact Memory |
| Started At | When the run began |
| Duration | Total execution time |
| Events | Number of events in the trace |
| Input Tokens | Tokens sent to LLMs |
| Output Tokens | Tokens received from LLMs |
Click any row to open the Trajectory Detail view.
Category Classification
ClawTrace automatically classifies trajectories into categories:
- Work — Normal agent tasks (default)
- Heartbeat — Periodic health check runs
- Compact Memory — Memory maintenance operations