Install the ClawTrace Plugin
The ClawTrace plugin for OpenClaw intercepts agent lifecycle events — session starts, LLM calls, tool executions, and sub-agent handoffs — and streams them to ClawTrace for analysis.
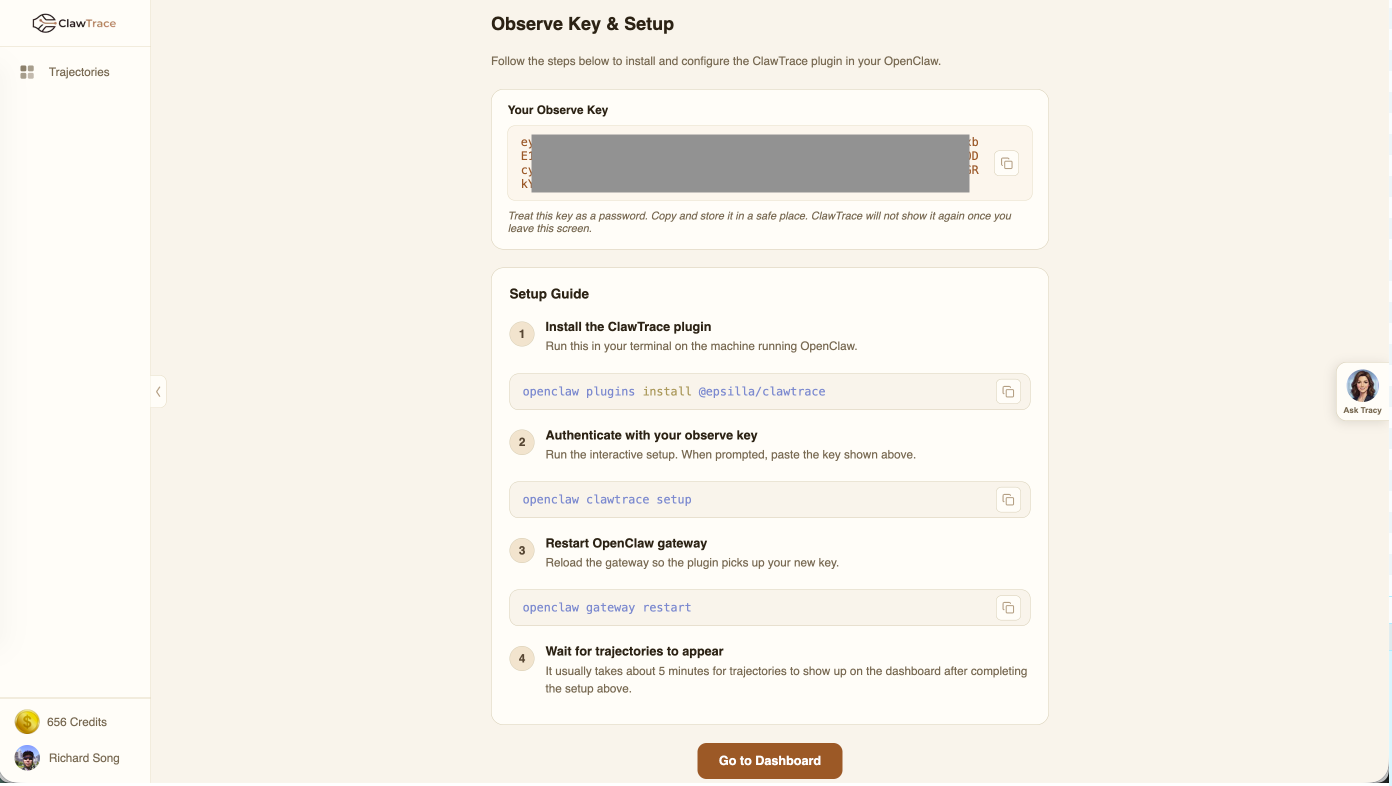
Step 1: Install the Plugin
Run this command on the machine where OpenClaw is running:
openclaw plugins install @epsilla/clawtrace
Step 2: Authenticate with Your Observe Key
Run the interactive setup and paste your observe key when prompted:
openclaw clawtrace setup
The plugin stores the key locally in your OpenClaw configuration directory.
Step 3: Restart the OpenClaw Gateway
Reload the gateway so the plugin picks up your new configuration:
openclaw gateway restart
Step 4: Wait for Trajectories
It usually takes about 5 minutes for trajectories to appear on your ClawTrace dashboard after completing the setup. The plugin buffers events and flushes them on agent shutdown or at regular intervals.
What the Plugin Captures
The ClawTrace plugin intercepts 8 hook types from OpenClaw:
| Hook | Description |
|---|---|
session_start |
Agent session begins |
session_end |
Agent session completes |
llm_input |
Prompt sent to LLM |
llm_output |
Response received from LLM |
before_tool_call |
Tool invocation starts |
after_tool_call |
Tool invocation completes |
subagent_spawning |
Sub-agent delegation begins |
subagent_ended |
Sub-agent delegation completes |
Next Steps
Once trajectories start appearing, head to the Connections Dashboard to see all your connected agents.