Usage History
The Usage page provides a detailed breakdown of how your credits are being spent over time. Access it from the View Usage button on the Billing page.
Time Range
Select a time range to analyze:
- 1 day — Hourly granularity
- 7 days — Daily granularity (default)
- 30 days — Daily granularity
- Custom — Pick any start and end date
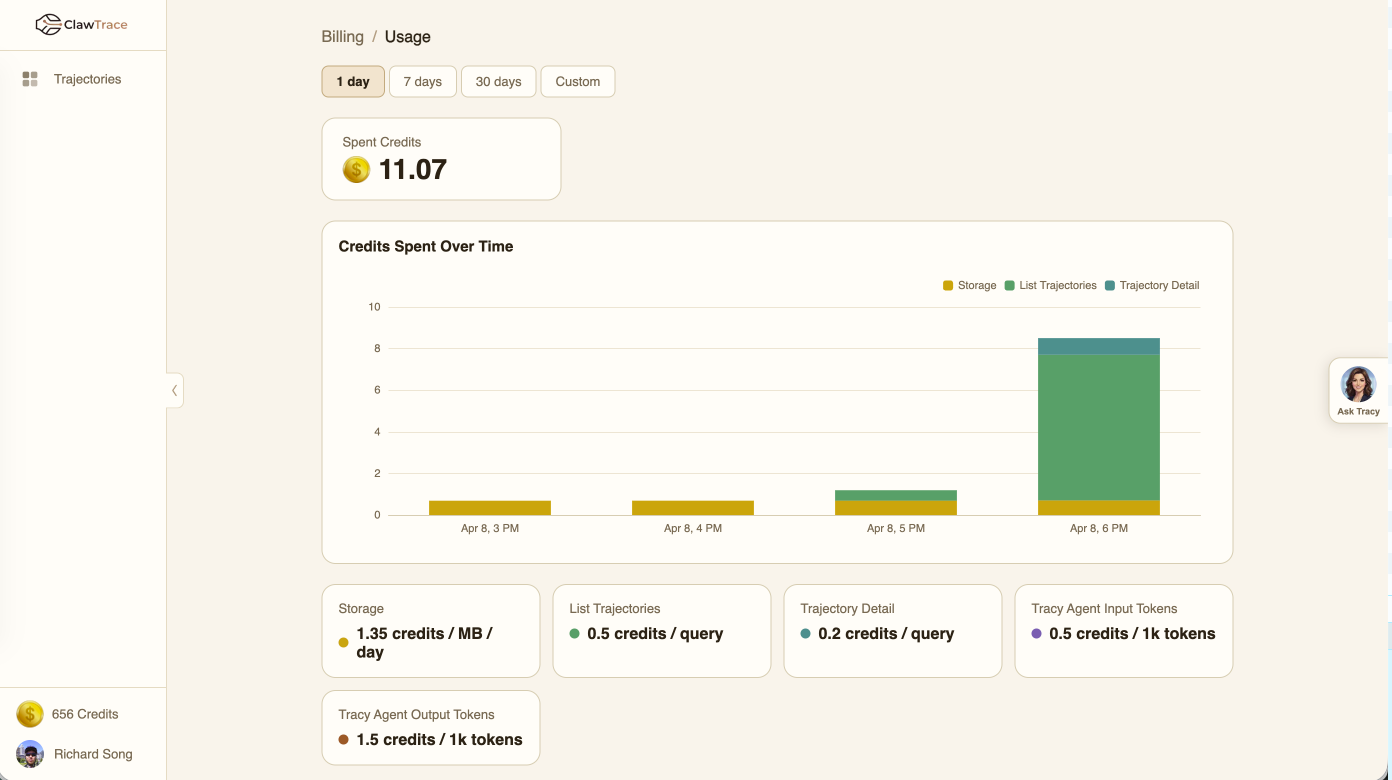
Spent Credits
A summary card shows the total credits consumed in the selected period.
Credits Spent Over Time
The stacked bar chart shows credit consumption broken down by category for each time period. Each bar segment is color-coded:
- Storage (gold) — Data lake storage costs
- List Trajectories (green) — Dashboard query costs
- Trajectory Detail (teal) — Detail view query costs
- Tracy Agent Input Tokens (purple) — Chat assistant input
- Tracy Agent Output Tokens (brown) — Chat assistant output
Hover over any bar to see the exact credit amounts per category.
Pricing Reference
Below the chart, pricing cards show the current rate for each cost category. These rates are used to calculate the credits consumed in your usage report.
Understanding Your Usage
- High storage costs? — Consider cleaning up old agent connections or reducing trace retention
- High query costs? — Dashboard auto-refreshes count as queries; reduce refresh frequency if needed
- High Tracy costs? — Tracy uses LLM tokens for each interaction; be concise in your prompts